A thesis built around a real safety problem
I developed this project as the thesis that earned my Systems Engineering degree with an AI focus. It addressed a road-safety problem in Lambayeque, Peru: driver drowsiness can impair neurocognitive functions, reduce reaction capacity, and contribute to preventable traffic accidents.
In 2024, integrated drowsiness-assistance capabilities were becoming common in parts of the European automotive market, but comparable systems were not yet broadly accessible in the local Latin American context. The work therefore focused on an applied, connected solution that could be evaluated in a real vehicle.
VIDDS: deep learning and IoT working together
The objective was to build and evaluate a system that detects possible driver drowsiness with deep learning and IoT, alerts the driver, records the incident, and makes it visible through a real-time monitoring platform. The result was VIDDS: the Very Intelligent Drowsiness Detection System.
VIDDS connects facial analysis, embedded computing, physical hardware, location tracking, backend services, MongoDB persistence, and an Angular monitoring dashboard. Its purpose is to help prevent accidents and the avoidable loss of drivers' lives.
The detection principle: Eye Aspect Ratio
The project uses the Eye Aspect Ratio (EAR), a scalar derived from six facial landmarks around an eye. The method is based on the work of Tereza Soukupová and Jan Čech (2016), whose real-time blink-detection research observes that EAR remains relatively stable while an eye is open and approaches zero as it closes.
The formula is EAR = (||p2 - p6|| + ||p3 - p5||) / (2||p1 - p4||). Its numerator adds the vertical distances between the eyelids, while its denominator measures the horizontal eye width. A lower value therefore indicates a more closed eye.
VIDDS applies this mathematical signal through its configured prototype rule. The system treats its configured zero-state condition as a possible drowsiness incident; this is an engineering rule for the prototype, not a universal or clinical diagnosis.
From facial landmarks to an eye signal
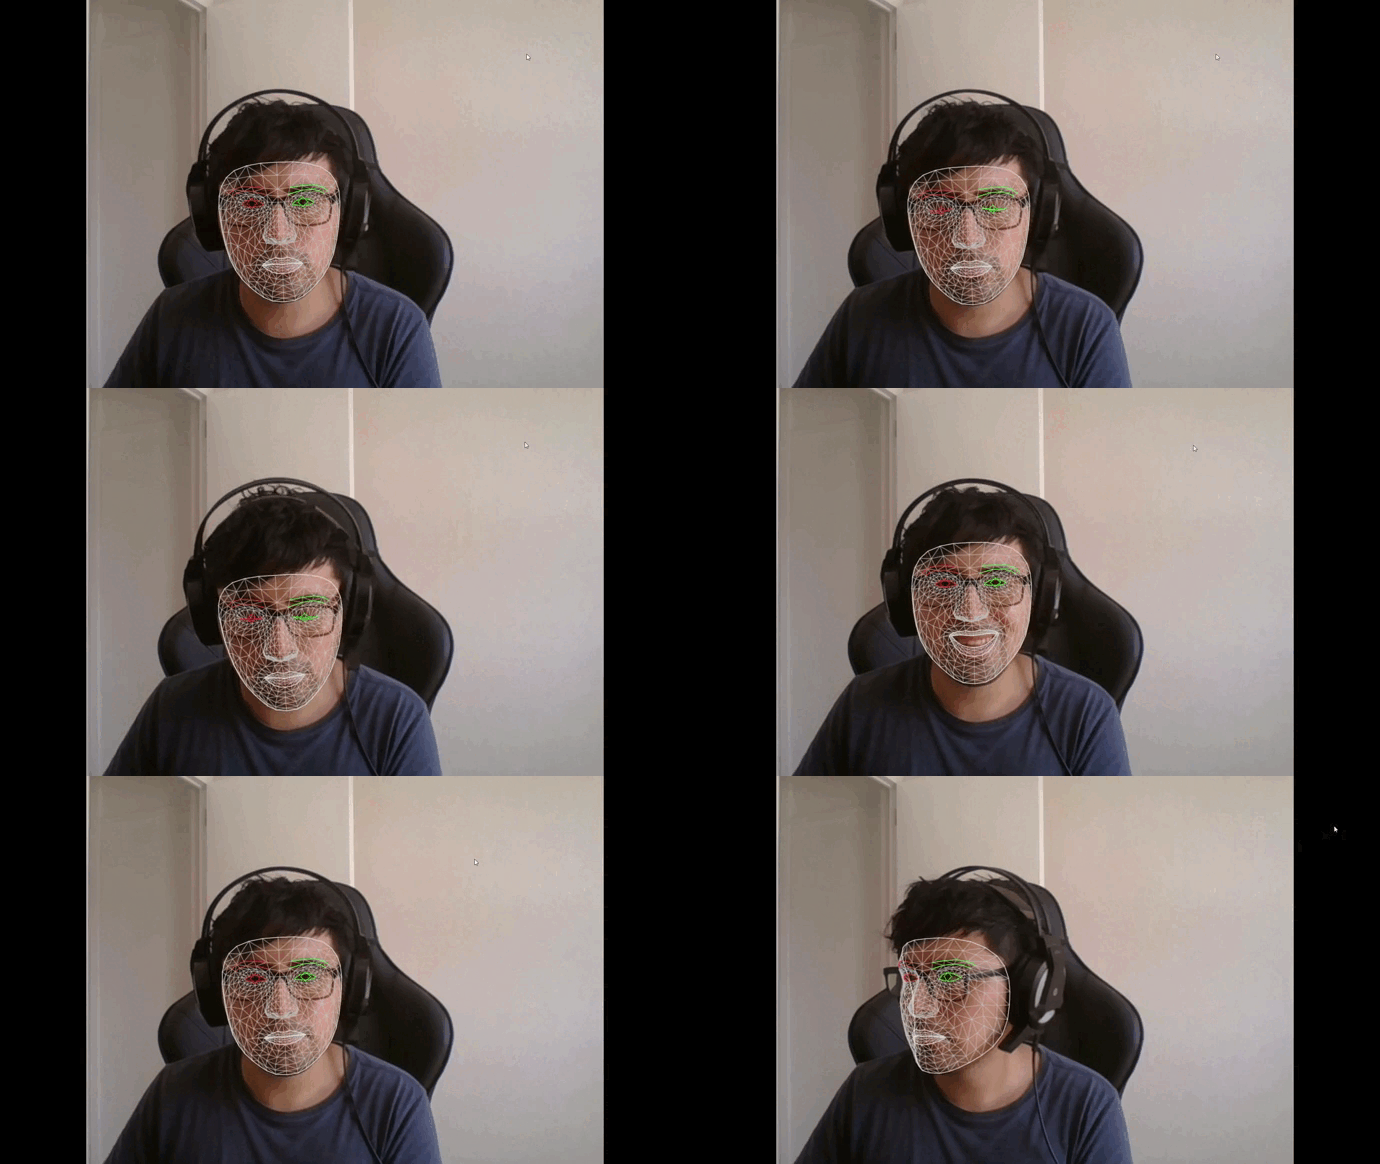
The detection flow begins with MediaPipe FaceMesh. The embedded Python application uses the model to track the driver's face and identify the landmarks around each eye that are required for the EAR calculation.
This tracking stage turns camera frames into stable landmark coordinates. The program can then continuously evaluate the eye state before deciding whether the configured drowsiness condition has occurred.
The VIDDS robotic prototype
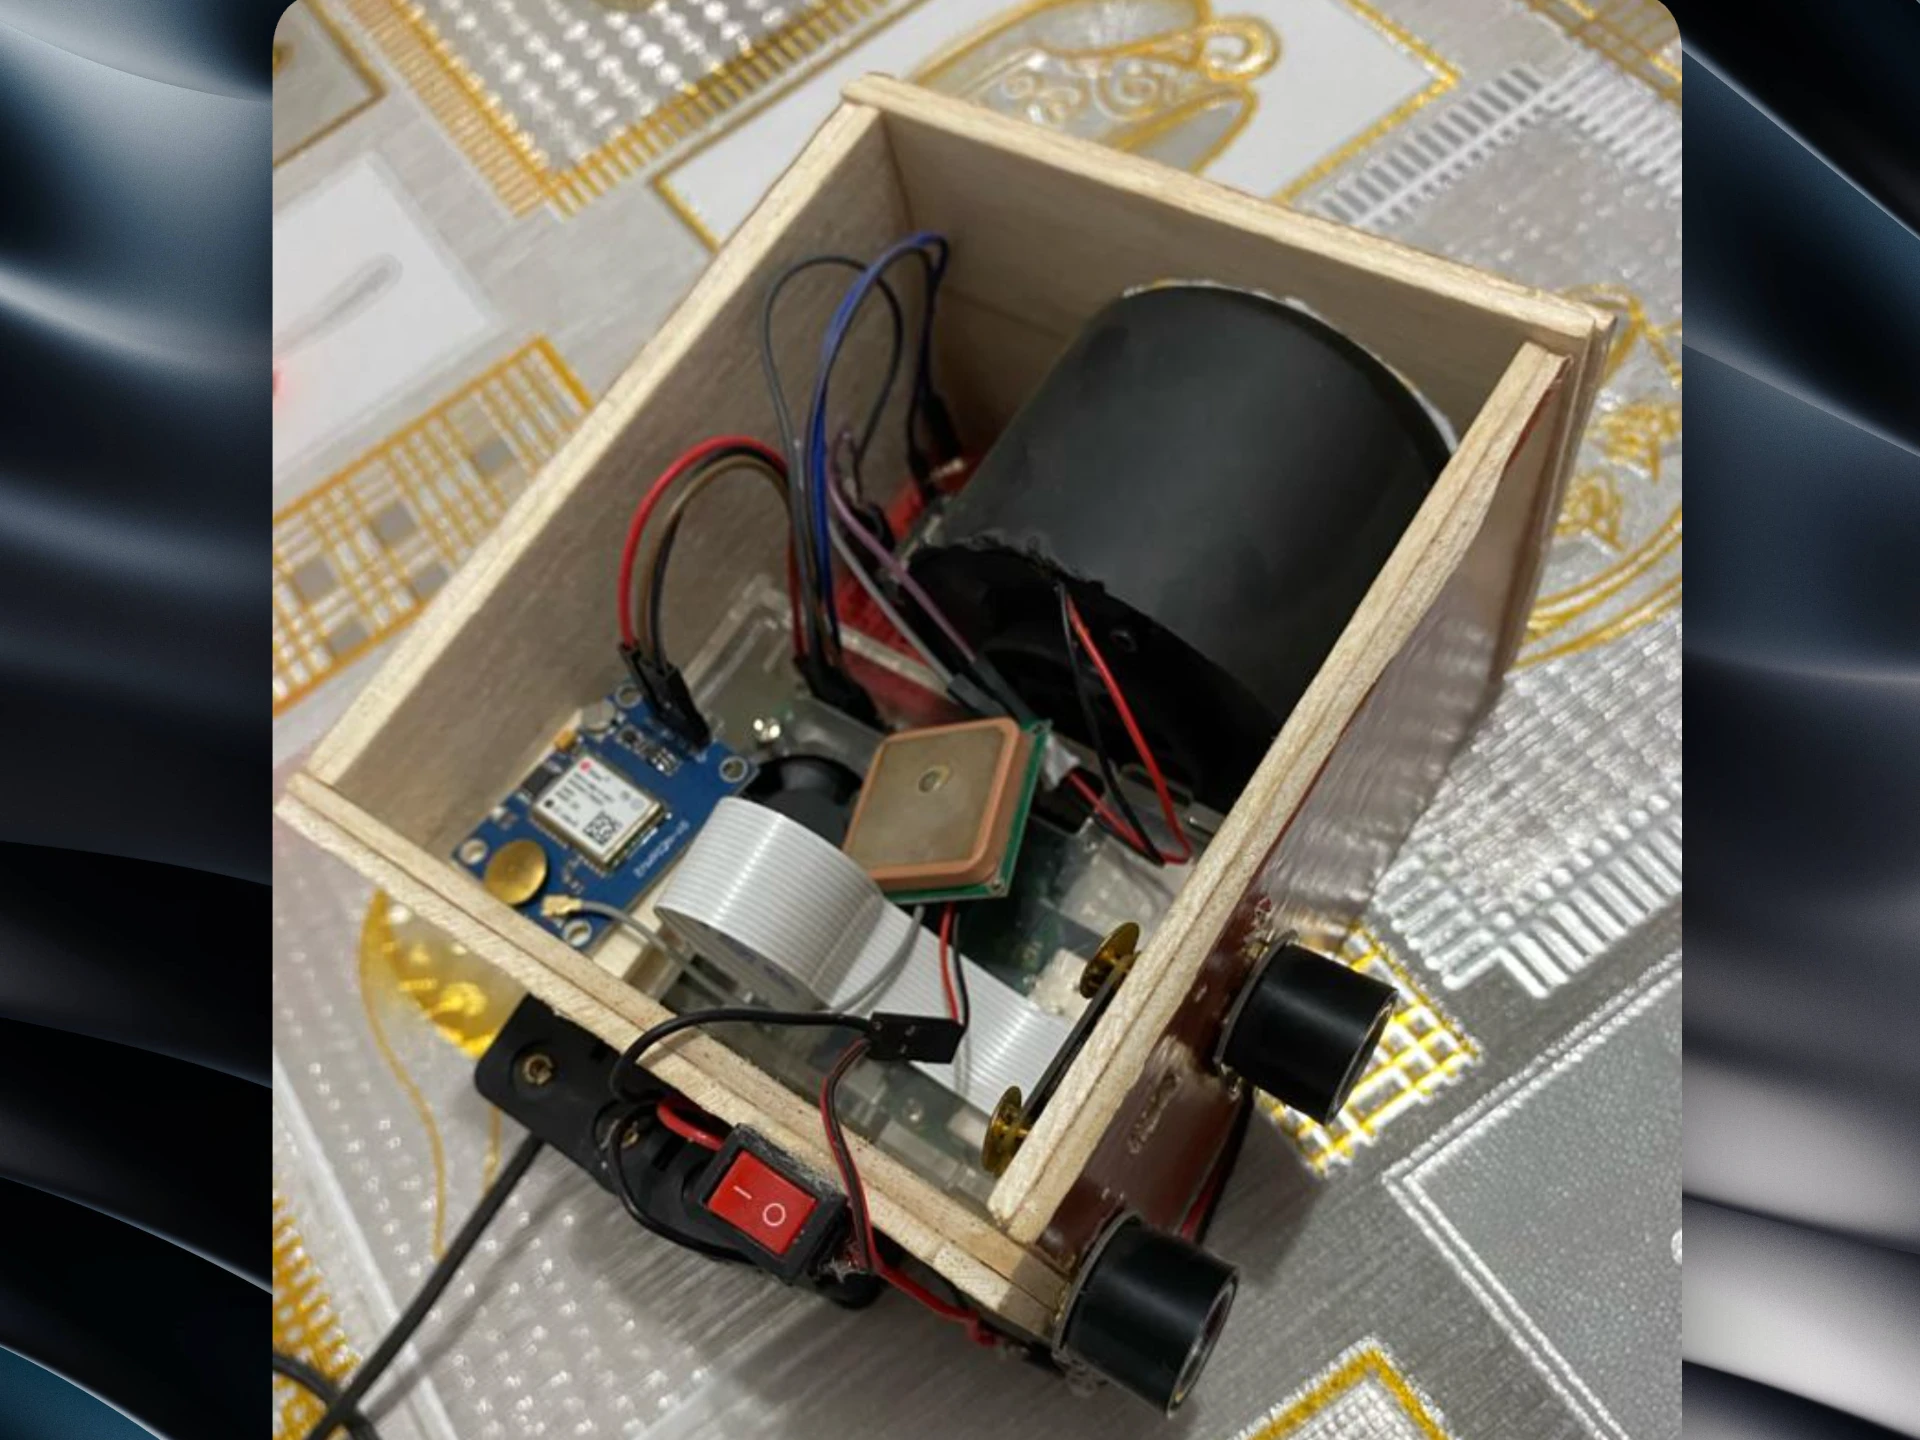
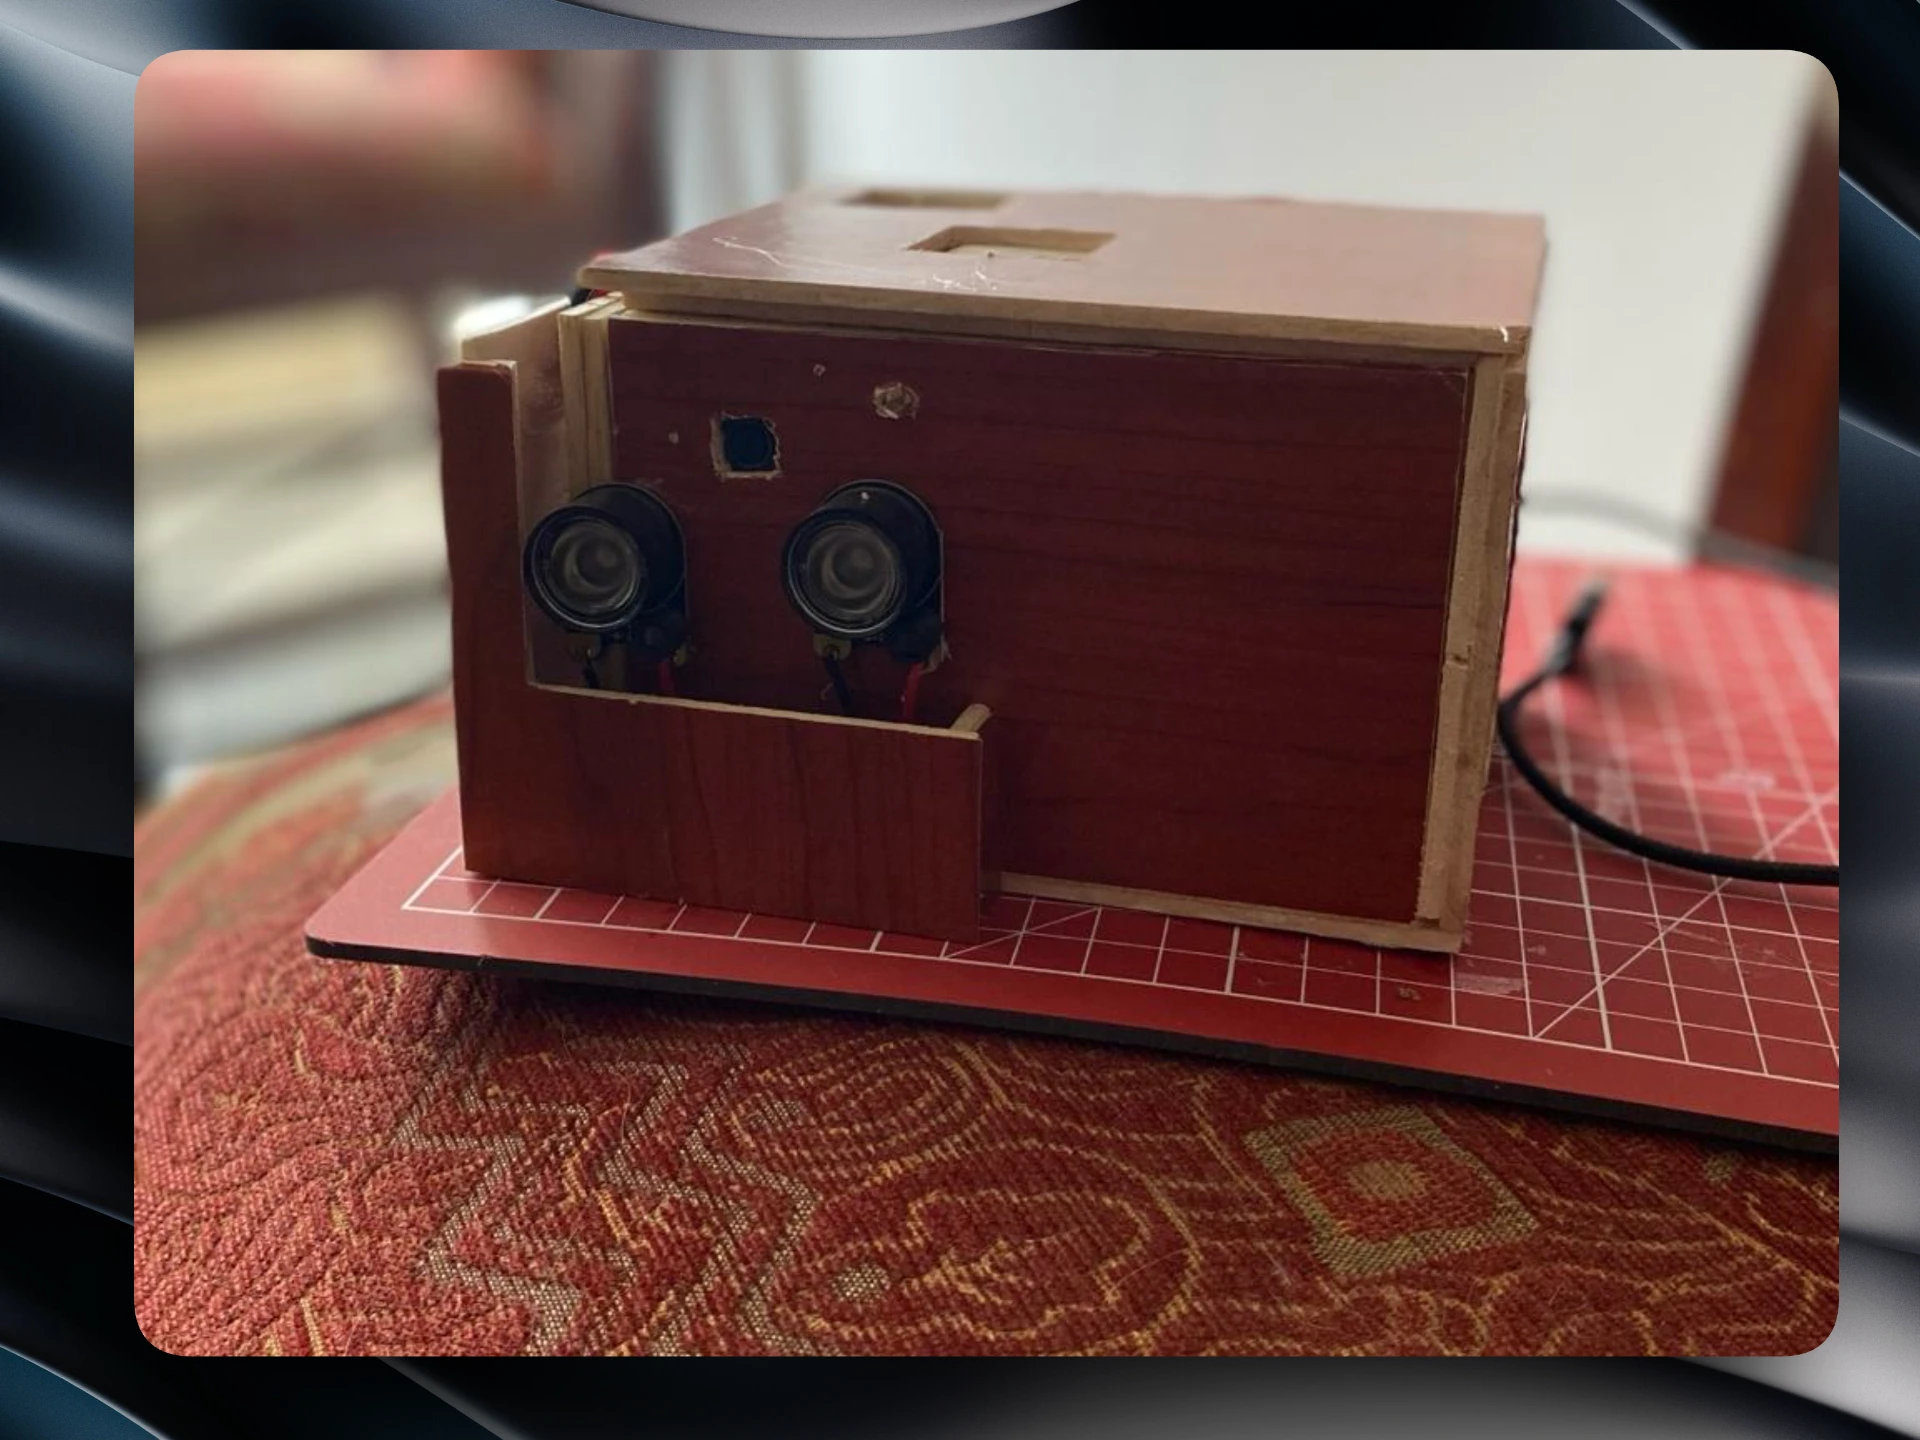
The embedded detection program runs on a Raspberry Pi 4B inside a physical prototype designed for use in a vehicle. The complete device combines:
- A Neo GPS module for location tracking.
- A DFPlayer Mini and an audio speaker for the warning workflow.
- A Raspberry Pi Noir Camera v2 for facial capture.
- An external battery for portable power.
- Infrared LED lights for low-light and dark environments.
- The Raspberry Pi 4B for embedded computation and communication with the platform.
From detection to a traceable safety incident
When the configured EAR condition identifies a possible drowsiness incident, the prototype immediately emits an audible warning through its speaker. During field testing, the alert sounded for approximately three to four seconds to prompt the driver to wake up.
At the same time, the device obtains its current GPS location and sends the incident to the Spring Boot backend through its API flow. The backend connects the embedded Python core with the Angular application and stores the incident in MongoDB for later consultation.
Incident visibility in real time
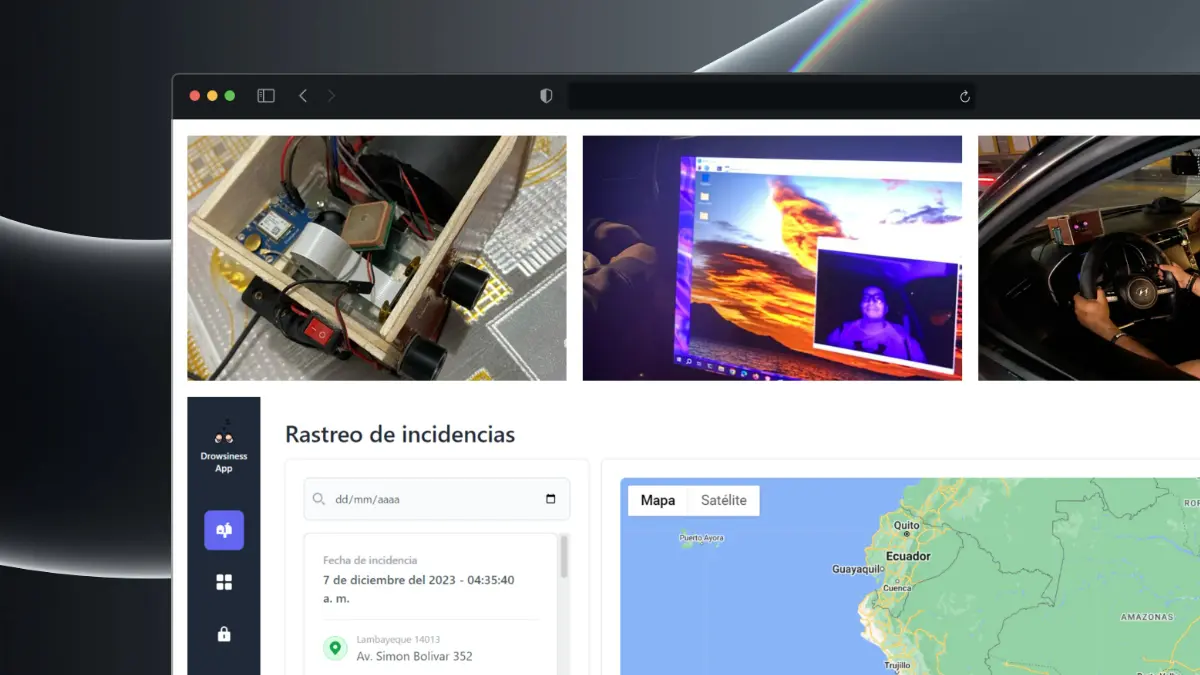
Each user is associated with a vehicle equipped with VIDDS. When the platform receives an incident, its Google Maps monitoring experience presents:
- The location of the event on an interactive map.
- The incident date and resolved address.
- The associated user and associated vehicle.
- An assistance-call action for follow-up.
Field validation in a real vehicle
VIDDS was evaluated in a real vehicle while a participant alternated between normal behavior and simulated falling asleep and asleep states. The validation covered different lighting conditions, head accessories, and glasses and no glasses.
When the participant simulated drowsiness, the physical prototype emitted its audible alert and the monitoring interface registered the resulting incident. This connected the driver scenario, the embedded device, GPS data, backend communication, stored records, and the dashboard in one end-to-end test.
VIDDS in a real vehicle
Engineering quality and operational confidence
VIDDS was developed as an observable and testable software system, not only as an AI experiment. Its quality practices included:
- Backend automated testing with JUnit and Mockito.
- Backend observability with Prometheus and Grafana.
- Frontend unit testing with Jest.
- Map-interactivity evaluation with Lighthouse and custom measurements.
- Performance checks intended to prevent the map from freezing the interface while incidents were displayed or updated.